Rinsing Manual
Evaluating your Existing Rinse System
To carry out a successful program of improvements to your rinsing system, you need to know what you're starting with. This section contains several field-proven methods to help you evaluate how well your system is currently performing.
- Where to find data
- How to measure water use
- How to use conductivity to evaluate rinsing
- How to define and measure rinse efficiency
- How to measure dragout
Where to find data Much of the data you will need to assess your existing rinse system can be found in shop records. But chances are you will have to determine some key items by making new measurements. The effort will be worthwhile, both to indicate where improvements would do the most good, and once they have been implemented, to document what savings have been achieved. Table 1 provides an overall summary of data requirements, together with recommended methods for collecting each type of data.Tip: During this process, document your work with photographs and video. Take still pictures of tanks, piping/valves, controls, racks/barrels, etc. Use video to capture racks/barrels draining over process tanks, air agitation, effectiveness of drip boards, etc. This information will help you to remember the characteristics of the plating line. They will also be useful if you are presenting ideas for rinsing improvement to management; words and numbers are not always convincing enough by themselves.
Table 1. Rinse System Information Requirements and Measurement Methods
Information Requirement Methodology Plating line schematic drawing Prepare a drawing:
- show all process and rinse tanks in the plating line
- prepare a separate process sequence list if tanks are not used in order
- label process tanks with function and temperature
- label all rinse tanks with function (e.g., immersion, spray, dragout, hot, etc.) and indicate water source for each rinse tank (e.g., city, RO/DI, previous rinse tank, etc.) and discharge points (e.g., to another rinse tank, wastewater treatment, etc.)
Water/sewer cost ($/1,000 gal.) Basic water/sewer costs can be found in monthly/quarterly bills. If DI or RO water is used, add additional cost for this treatment (typically DI/RO cost is $3 to $8/1,000 gal, with higher cost associated with rental DI canisters). Water Use Measure water use for each rinse tank or rinse system. Express as gpm and gpd. See section on water flow measurements. Wastewater treatment cost Calculate the cost of treating wastewater (treatment reagents) or use an industry average (ranges from $5 to $15 per 1,000 gallon, not including sludge disposal, with higher cost associated with smaller systems). The median cost from the EPA P2 Project survey was $10.28/1,000 gal. Sludge generation and disposal cost Sludge generation and disposal costs vary significantly from shop to shop, so use your actual vales. From the EPA P2 Project survey, the median sludge generation rate was 5.26 lbs/1,000 gal of wastewater treated. The median disposal price was $1.67/Lb. Water temperature Measure and record the water temperature of the rinse tanks. Perform this task monthly to establish seasonal variations. Rinse tank piping/ overflow configuration (check for short circuiting) Determine exact piping arrangement of rinse tanks. Is water evenly distributed into tank with PVC pipe on bottom or just entering at single point? Is the discharge located at the opposite end of tank from input? Flow controls/measurement For each rinse tank identify how the flow rate of incoming water is controlled (e.g., hand valve, flow restrictor, conductivity controller, timer controller, etc.) and if flow measurement devices (meter, accumulator) are present. Agitation Identify method of rinse tank agitation, if present. For air agitation, note air source(s) and controls. Use rinse efficiency measurement (see below) as a partial measure of how well the air agitation system is working. [link to air agitation video] Dip/drain boards Identify drip/drain boards (or lack of) and note their effectiveness for returning dragout to the process tanks. Dragout For plating tanks, measure the dragout rate and express it per workload (e.g., gal/rack) and daily rates (gal/day). This can be accomplished using a conductivity meter. See the section on how to measure dragout rates. Conductivity of rinse water Measure and record the conductivity of each rinse tank under steady state conditions, if possible. For highly variable workloads, this will require frequent sampling (approximately every 30 min) over the course of a typical day. See section on conductivity measurements for more information. Rinse efficiency Measure rinse efficiency for each rinse tank. This can be done using a conductivity meter. See section on how to measure rinse efficiency. Racks and barrels Check condition of racks and barrels for potential maintenance issues that may affect dragout rates or rinsing efficiency. For example, look for cracked/broken rack coatings. [link to broken rack photo] Position of parts on rack Check design of racks to determine if parts are positioned one above the other or staggered to allow an unobstructed path for draining dragout. Dwell time in rinse tank Measure the amount of time that a rack/barrel remains in the rinse tank. Rack withdrawal rate Measure the amount of time it takes to withdraw a rack from the plating tanks. Drain time Measure the amount of time that racks/barrels are suspended over a process tank after being removed and before being transported to the next tank. [link to draining video] Barrel rotation Observe removal of barrels from process and rinse tanks. Barrels should be suspended above tank and rotated until a minimal amount of dripping occurs. The following sections provide details for measuring some of the parameters listed in Table 1.
How to measure water use There are various accurate methods for measuring water use for a particular rinse system. The following simple method works well for most immersion rinses:
- Close water valves leading to the rinse tank and turn off air agitation, if present.
- Using a bucket, bail out 20 gallons of water.
- Reopen water valve and measure the time it takes to refill the rinse tank (e.g., 5 min.).
- Divide 20 gallons by the number of minutes it took to refill the tank (e.g., 20 gal./5 min. = 4 gpm).
Some rinse systems may require a more innovative approach to attain an accurate flow measurement. For example, spray rinses can present a challenge. In some cases it is possible to measure the flow rate from a single nozzle and multiply that by the total number of nozzles present.
How to use conductivity to evaluate rinsing Conductivity is used in various industrial and environmental fields to estimate the cleanliness of water. In the plating shop, conductivity measurements can be used to quickly generate a lot of very useful data. The instruments involved are relatively inexpensive to purchase and easy to use. On the other hand, an analysis of specific ions, like metals, requires expensive analytical equipment and a trained technician, and there is usually a significant time delay between sampling and getting results.Conductivity meter readouts are usually in microsiemens/centimeter (μs/cm). Some models may also display total dissolved solids (TDS), which is related to conductivity by a factor dependent upon the level and type of ions present. For our discussion, we use μs/cm.
Conductivity meters do have some shortfalls. Most importantly: in the plating shop, you should only compare conductivity measurements for like chemistries. For example, you can compare the conductivity of a rinse following an alkaline cleaner to another rinse following alkaline cleaners. But it would not make sense to compare the conductivity measurements of rinses following different chemistries, for example trying to compare a rinse following an alkaline cleaner to a rinse following an acid dip. They can't be compared because the ions that make up acid dips have a much higher conductivity than the ions that make up alkaline cleaners. Comparing those readings is like comparing apples to oranges.
Before measuring the conductivity of rinse water, calibrate the instrument following the instructions for your unit. Conductivity is affected by temperature: the warmer the water, the higher the conductivity. Most conductivity meters have built-in temperature compensation. For units without temperature compensation, calibrate the instrument at the same temperature as the solution being measured, or store the samples in a suitable location until they reach the desired temperature.
Various literature sources have published acceptable conductivity limits for rinses that follow certain process tanks. These limits are suggestions on how clean the rinse tank water needs to be in order to provide adequate rinsing. Some common limits are shown in Table 2. If the conductivity of your rinse tanks is very different from these values, then the flow of rinse water may be too high or too low. As discussed below, the conductivity of a rinse water does not tell the whole story. Your rinse tanks may meet the acceptable limits, but your parts may not be sufficiently clean after rinsing.
It is recommended that shops collect rinse tank conductively measurements on a regular basis and save the data. This record will help you determine if rinse water is being under used or overused. The data will also be useful when evaluating options for improving rinsing practices.
Table 2. Commonly Used Conductivity Limits for Certain Processes
Rinse Tank for: Conductivity (μs/cm) Alkaline cleaner 1,700 Hydrochloric acid 5,000 Sulfuric acid 4,000 Tin alkaline plate 200 Nickel plate 600 Zinc acid plate 600 Chromic acid plate 600
How to define and measure rinse efficiencyTracking the conductivity of rinse tank water is a useful practice. As discussed above, you can compare conductivity data to industry standards to help determine if your water use rate is sufficient, or if you are using more water than necessary. However, during the EPA P2 project, it was discovered that just relying on rinse tank water samples can be misleading, and that a more detailed approach is needed to evaluate the overall efficiency of the process.
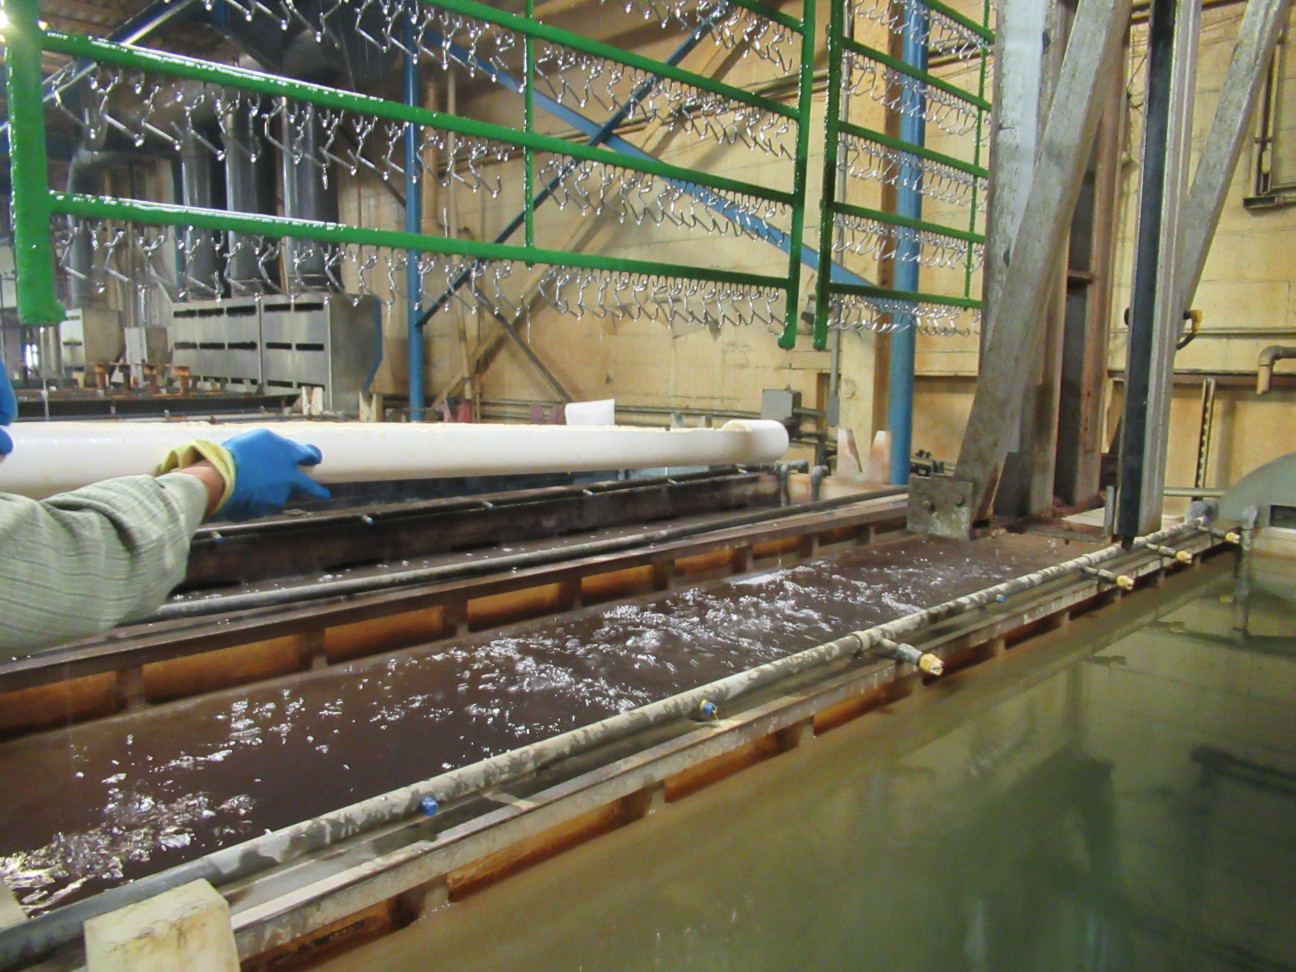
Figure 1. Sampling tube in use for capturing dragout and measuring rinse efficiency More important than the conductivity of the rinse tank water is the conductivity of the water remaining on the parts and racks/barrels after rinsing. After all, the purpose of rinsing to remove the process chemistry from the racks/barrels and parts to prevent carryover to the next process tank, or in the case of a final rinse, to prevent staining. Intuitively, one would think that the conductivity of the rinse tank and the conductivity of the water remaining on the parts after rinsing is about the same. However, testing during the EPA P2 project showed that these two values can be very different.
Apparently some of the water clinging to the parts and racks/barrels going into the rinse tank is not being completely replaced by the cleaner water in the tank. A useful measure of the extent of this effect is the "rinse efficiency", defined as C1/C2, where:
- C1 = the conductivity of the water remaining on the rack or parts after rinsing
- C2 = the conductivity of the rinse tank water
Under ideal conditions, C1/C2 = 1. However, testing performed under EPA P2 project showed that the ratio of C1/C2 is usually above 2.0, and can be much higher. Lowering the C1/C2 ratio, by say 25%, can result in a corresponding decrease in water use and wastewater generation. For this reason, it is important first to measure rinse efficiency, and then to find ways of improving it.
C1 can be measured by capturing the drips of water coming off of the rack or barrel and parts after being removed from a rinse tank. During the EPA P2 project, this was accomplished using a long section of 2 inch PVC pipe that was cut in half lengthwise and capped on the ends. When the rack was lifted from the rinse tank water, the pipe was held under the rack and it captured the dripping water. The sample (C1) was then measured for conductivity. A sample of the rinse tank was also taken and measured for conductivity (C2).
Rinse efficiency data from the P2 Study are shown in Table 3. These results indicate that air agitation has a significant effect on rinse efficiency.
In summary, rinse efficiency measurements can be a valuable tool for evaluating whether good rinsing is being achieved, and for analyzing potential rinsing improvements. Based on the limited data from the EPA P2 project, it appears that a reasonable target value for good rinsing is a C1/C2 ratio of 2.5 or less. However, more data, taken under a broad range of conditions, need to be evaluated before firm values are established. We hope to expand the database and update this report in the future.
Table 3. Rinse Efficiency for Various Levels of Air Agitation
Conditions Average Conductivity (μs/cm) of Water Remaining on Parts (C1) Average Conductivity (μs/cm) of Rinse Tank Water (C2) Rinse Efficiency (C1/C2) No air agitation 1.60 0.51 3.14 Moderate air agitation 0.95 0.50 1.90
How to measure dragout To evaluate rinsing alternatives, the plater needs dragout and water use data, rinse quality criteria and equations that turn these data and criteria into useful information. Of these items, detailed and accurate dragout data can be the most difficult and costly to obtain, due to the expensive analytical work required. But conductivity measurements can often provide a simpler and much less expensive way to obtain a reasonably good indication of rinsing system performance. If you know the volume of the rinse tank, the conductivity of the process bath, and the increase in conductivity in the rinse tank after a certain number of racks or barrels have moved from the process bath to the rinse tank, you can calculate what volume of process solution must have been transferred over to cause that amount of increase. The following procedure can help ensure a representative sample, and does not require advanced equipment or training:where:
- Measure the volume of the rinse tank (V).
- Start with a relatively clean rinse tank: if possible, drain and refill the entire tank with fresh water; if not, drain at least 50% of the tank and refill with fresh water.
- Eliminate any fresh water flow into the rinse tank for the duration of the test by closing all water valves
.- Sample the rinse water and measure its conductivity in microsiemens/centimeter (μs/cm). Call this value Cstart.
- Operate the plating line in normal fashion, while tracking the number of racks or barrels processed through the rinse tank (N). The length of the test is up to you; however, the more racks or barrels going through the rinse tank, the more accurate your dragout measurement will be. If possible, process at least 10 racks or barrels through the rinse tank. If the number of parts is highly variable per rack or barrel, you will need to process a higher number in order to arrive at an accurate average dragout rate.
- After completing your test, take a sample of the rinse water and measure its conductivity. Call this value Cend.
- Take a sample of the process solution that proceeds the rinse tank and measure its conductivity. To accomplish this, you will need to dilute the process tank sample because its conductivity will exceed the range of the conductivity meter. Typically a 1,000 to 1 dilution will suffice (1 ml of process solution is diluted to 1,000 ml with distilled water). Multiply the result of the diluted sample by 1,000 to calculate the conductivity of the process bath (Cbath).
- Calculate the total volume of dragout for the time period of the test: Dtotal = (Cend - Cstart) * V / Cbath
- Calculate the average volume of dragout per rack or barrel: Davg = Dtotal / N
- Cstart = Conductivity of the rinse tank at start of test (μs/cm)
- Cend = Conductivity of the rinse tank at end of test (μs/cm)
- N = Number of racks or barrels processed through the rinse tank during the test
- V = Volume of rinse tank (gal.)
- Cbath = Conductivity of the process bath (μs/cm)
Once you know the average dragout rate per rack or barrel you can covert this to dragout volume per day by multiplying D by the number of racks or barrels normally processed each day.
The dragout rate will vary for the different process tanks on the plating line, mostly due to the viscosity of the solutions. For example, plating solutions and alkaline cleaners will have higher dragout rates than acid dips. The dragout methodology described above can be used for any process solution. However, if you are limited in time and cannot check each process tank on the line, then your focus should be the plating solution, since the dragout from the plating tank is usually the greatest contributor to wastewater treatment costs and sludge generation.